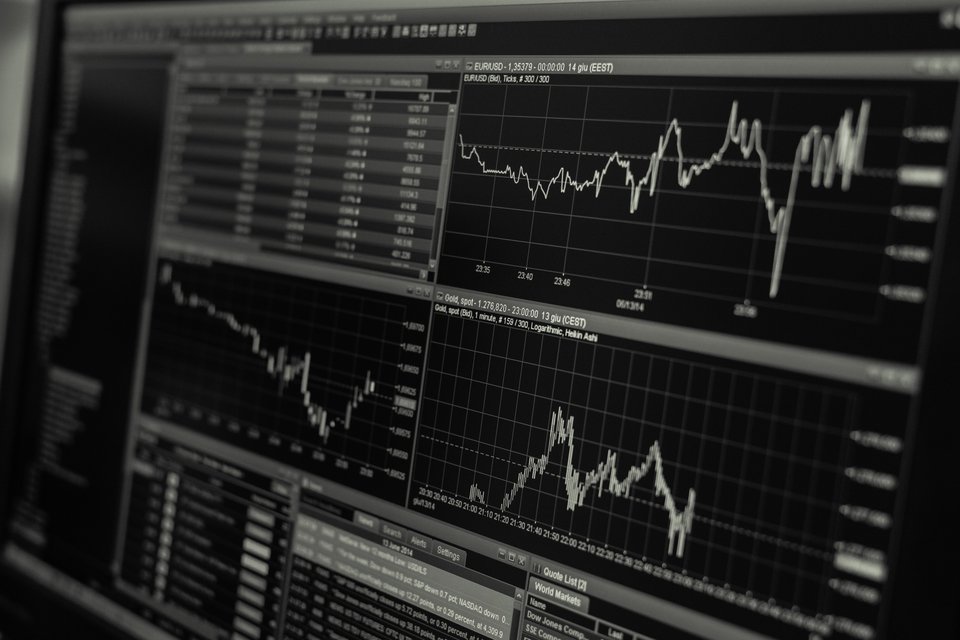
Trading charts are one of the most essential tools that speculators use. In order to trade markets successfully, it is critical that you know what a chart is, and how to read it.
Below you will learn how to read Forex charts so that you can use them to assist your trading.
An Overview of Forex Charts
Simply put, a Forex chart graphically depicts the exchange rate between currencies over a given time period. Through analysis of these charts Technical traders can make predictions about the future movements of the currencies they want to trade. I underline, it is very common among Technical traders the use of charts and chart patterns as the only source of their trading decisions.
Types of Forex Charts
There is not a single type of Forex chart, that can give you enough information in fact, there are many different types of charts that are unique in their own way.
Different types of charts can be used to better depict specific trading data and are more appropriate for certain trading strategies. Let’s get familiar with types of charts that exist out there:
As we can see, there are many types of Forex charts, however, of these the most used by Forex traders are the Candlestick and Bar charts.
These charts graphically display four pieces of information on each “candlestick” or a bar. This includes the open, close, high and low price points for the time period selected.
Now, out of these two, candlestick charts are voted to be the most useful in depicting the price information. By having an extra “fatness” in their bodies, it allows candlestick charts to display a large amount of information inside of a selected time period.
It appears that with candlesticks you can see, more clearly, how price has behaved during the specific time period.

How to Read Forex Charts: Understanding Timeframes on Forex Charts
Usually you will be able to control the timeframe displayed on a chart. Each point on a graph displays the trading data for that particular time period.
For example, if you were to select a one day trading period, then each point on the graph is the trading data from a one day period. If you were to instead select one minute, then each trading period would represent one minute of trading data. With most charting software you can select data from time periods of as little as seconds up to thirty days.
Also, see: How To Make Sense Of a Global Macro Hedge Fund?
How to Read Forex Charts: Using Indicators As A Guide
Reading a chart requires that you are able to interpret the data that is being presented.
To make that task easier traders use what are called indicators. Indicators act as a type of visual guide of how the currency pair has been moving. Using indicators can determine which way a currency appears to be trending. There are a number of different types of indicators with some of the most popular including:
Moving Average Lines, Relative Strength Index, Bollinger Bands, Moving Average Convergence Divergence (MACD) and Stochastic.
Moving Average Lines are one of the simplest and, most commonly used indicators.
In order to determine the moving average you take the total of all the closing prices and divide this by the number of periods. Using a moving average you can remove the variance from your chart giving you a smoothed out picture of the overall price trend.
Most popular among the Institutional traders are 20; 50; 200-period moving averages.
The relative strength index (RSI) gives an indication of both the overall direction of prices and their velocity. RSI works by comparing any downward movements in the price to upward movements over a set period of time. Typically fourteen periods are used when measuring using RSI.
Bollinger bands are another very popular type of indicator. These measure the standard deviation of price movements around a moving average. When there is a lower amount of price volatility the bands will contract. When there is a large amount of volatility the bands expand.
MACD is actually a very practical indicator, and it does exactly what the name implies; It measures the relationship between two Exponential Moving Averages.
By far, the most commonly used settings are 12 and 26 periods along with the signal line of 9 periods. Usually, it is one of the first oscillating indicators that traders will apply to their chart, maybe with the exception of Stochastic, which we cover later on.
Despite its popularity, as being a versatile tool, MACD does not work all the time, which is something that can be noted right about every indicator that is based on past price information.
Stochastic is another very widely used indicator. It is a simple momentum oscillator that was developed by George Lane in the late 1950’s.
Being a momentum oscillator, Stochastic indicator can help to determine when a currency pair is oversold, or overbought.
However, I will mention it again; stochastic signals do not work all the time. Currency, as well as any other trading instrument, can stay overbought, or oversold for lengthy periods of time.
In our opinion, the true strength of the indicator comes from its momentum properties. Meaning, the momentum, the speed of any trading asset changes before the price changes itself. Hence, the stochastic oscillator can be used to foresee reversals when the indicator paints bullish or bearish divergences.

Conclusion
Charts are merely tools to help guide your trading.
As a tool they are only as effective as your ability to use them.
Invest time into understanding what the different types of charts and indicators are, and how they can be used in your trading.
You’ll be surprised to find out in how many ways the charts could help to interpret market intentions. Used correctly charts can be one of the most effective ways of improving your trading.
What trading tools are you using to improve your trading?
Please let us know by commenting below…
