The MACD indicator mt4 is the most popular and the most widely used among technical indicators. However, not many traders realize that the indicator is considered to be a derivative of an indicator. It uses an Exponential Moving Averages in its calculation.
Meaning, it derives the values from the indicator, the moving average indicator to give readings to a trader.
Learning to use the short-term momentum to your advantage could be a daunting task. And, it could get significantly more challenging when one is uninformed of the right tools that actually can help.
The article below will dissect “MACD indicator for mt4” this notoriously popular indicator and highlight its most widely known implementations!
The History
Gerald Appel introduced the MACD in the 1970s, and since then, it became one of the most popular indicators used by traders all around the world.
The actual function of this technical tool is to discover trend direction.
At the same time, it is also used in evaluating momentum and spotting possible reversal points.
The tool can work extremely well in conjunction with other indicators, but it was proven by time to be powerful enough as a standalone strategy.
The reason the MACD indicator is so popular, because it combines together trend and momentum in one technical tool. This unique indicator can be successfully applied to longer term charts; Daily, Weekly, Monthly, as well as to shorter time-frames.
Making Sense of the MACD Indicator
The MACD indicator mt4 is commonly inserted underneath the trading chart, in a separate window. The Moving Average Convergence Divergence is a fairly simple to use technical tool.
Nevertheless, it would make much more sense to fully understand it before trying to trade its signals. So, let’s bring a closer look at the design of the MACD indicator, together with its default settings.

What are the two lines in MACD – (The MACD Indicator Structure)
As we have mentioned before, the MACD is a fairly simple indicator that uses three basic components to generate trading signals.
Let’s now highlight each of these separately:
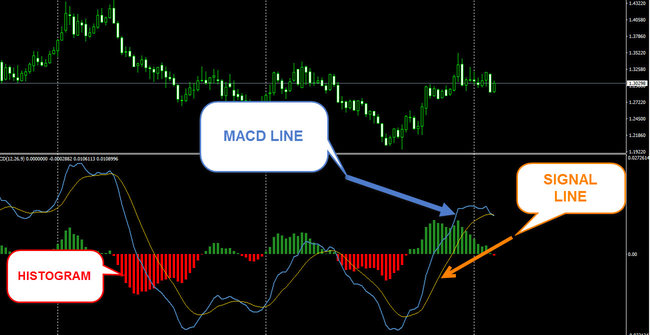
#1) The MACD Line
The MACD line is the fastest line on the indicator. Since it is inherently more sensitive it reacts faster and generally moves above/below the second line.
#2) The MACD Signal Line
The second line is called the MACD signal line. It is given such name, because it produces the most common MACD signals. Given the fact that this line is slower, it gets frequently crossed by the above mentioned, and “inherently faster” MACD Line.
#3) The MACD Histogram
The histogram is merely a pictorial representation of the difference between the MACD line and the signal line. Basically, it calculates the difference between the MACD line and the Signal line displaying it in a histogram format. Now, the MACD histogram was added to the indicator later on – sixteen years later, to be exact. It was modified by professional trader & analyst Thomas Aspray in 1986.
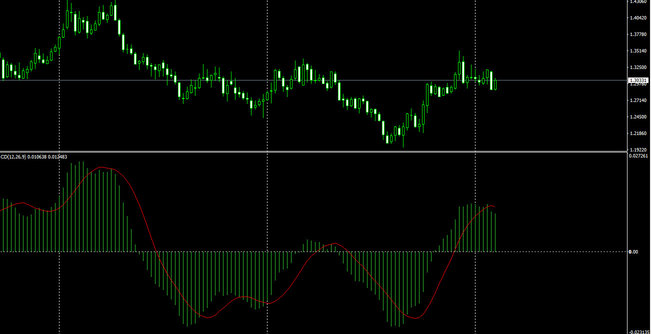
Here is the classic version of this tool, described above:
And like the MACD itself, the Histogram is also considered to be an oscillator, because it fluctuates below and above the zero line.
The reason Aspray modified the MACD indicator by adding the Histogram, is to anticipate the signal line crossovers.
The key word here is to anticipate! The bigger is the gap between the lines, the higher are the bars of the MACD histogram and vice versa.
How do I set up MACD indicator?
The default MACD parameters are 12-26-9. These are the original and the most common settings for the majority of trading platforms.
Let’s interpret these numbers and find out how they interact with the fabric of the indicator.
As I’ve mentioned earlier, the MACD is an indicator of an indicator. It uses the difference of the 12 and the 26 Exponential Moving Averages of a given security. The indicator calculates a 12 period EMA, then subtracts a 26 period EMA from it.
Finally, it plots the result in a form of the MACD Line – the faster line. Basically, the MACD Line is the difference between the above mentioned 12 & 26 Exponential Moving Averages.
The number 9 is the Signal Line. It is a product of the 9 period Exponential Moving Average that is plotted on the MACD Line. Actually, this is the reason why the Signal Line is slower than the MACD Line, because of this smoothing factor.
Traders have an option to optimize the default parameters by changing the indicator settings from the menu.
For example, if you are looking for more sensitive readings on Weekly & Monthly charts, you may want to try the 5-35-5, or the 5-15-5 settings.
Alternatively, if you are trying to reduce the whipsaw action, the frequent signal line crossovers on the shorter time-frames, you may choose to lengthen the variables.
What settings to use is totally up to traders’ discretion. There are no right or wrong MACD parameters, however, sticking with the default settings and using the indicator as it was meant by the designer, on the longer time-frames, is certainly advisable.
Also check:
How Knowing About The Stop Hunting Forex Can Make You A Better Trader.
Trading with the MACD Indicator – (The Signals)
Despite the fact that the MACD is a simple indicator, nevertheless it can produce a myriad of trading signals. In this article we’re going to look at the most common ones.
The Zero Line Crossovers (Up or Down)
The MACD zero line crossing over happens when both the MACD line and the Signal line crosses above/below the zero point on the chart. In most cases this type of behavior occurs in strong trending conditions. Meaning, the zero line crossover happens after the trend has been reversed.
In such cases, the MACD line and the Signal line, both are pointing upwards or downwards with good separation between them. In addition, the MACD histogram is either steadily rising or declining without any indication of momentum slowing down.
This happens, mostly when the trending conditions have been in full throttle for quite some time.
The Signal Line Crossovers (Up or Down)
This is probably the easiest way to use the MACD indicator as it requires simply watching the MACD line as it goes above the Signal line for going long (buying), and going short (selling) when the MACD line goes below the Signal line.
Now, I have to warn you, this method produces the most trading signals! Therefore, it also generates a myriad of false entries.
Thus, the chances of getting into a bad trade, when solely relied on this signal, are very high.
Many speculators are using the MACD indicator mt4 in conjunction with other technical indicators such as; Stochastic, Relative Strength Index and other oscillators, along with pure price action techniques to confirm these type of signals.
Bullish & Bearish Divergences
Divergence takes place when the price action and the MACD indicator do not agree on the direction. This happens when the indicator is not moving in tandem with the price action, hence the term divergence. Bottom line, the price and the MACD are diverging from each other.
This can be interpreted as an indication that momentum is slowing down with the possibility of a complete market reversal.
It could be indicating the end of the existing bullish or bearish run and the start of a new directional move in the opposite direction. Traders will simply look to catch that reversal of the existing trend, especially when the trading instrument is being over extended for several weeks.
How Do you trade with MACD – (General Concept)
There are two primary uses for the indicator, each offering its advantages and disadvantages.
Basically, you either use it in trending or in non-trending conditions. Knowing how to apply the indicator in different market environments will certainly help to reduce some of the loosing signals.
Using MACD in Trending Conditions:
Using MACD in Ranging, Non-Trending Conditions:
Honestly, I advise NOT to use the MACD indicator in range-bound conditions!
It is not an effective tool when the Markets are flat… It is a Momentum as well as a Trending indicator. On the other hand, everything depends on the range itself. For example, if we have a wide (200 – 400 pips) range, then by all means, you may use it.
However, if we have a tighter (100 – 200 pips) range, then you should be asking yourself the following question: “Does it make sense, if I apply the MACD indicator for such environment?”
More often than, not you will be whipsawed in tight ranges, and that is a fact. Lets not forget, the MACD indicator was primarily designed for trading stocks.
This implies, it had to be used on longer time-frames so, using this technical tool on shorter (30-15-5 minutes) time-periods is not advisable.
The best use of MACD Indicator:
How do you use MACD in forex trading?
The clear trend changing signals help minimize subjectivity from the decision-making process.
The Signal Line crossovers make it easy for speculators to confirm that they are participating in the right directional momentum.
In the event, when the MACD Line and the Signal line, both appear above the zero level, pointing upwards, it suggests a strong up-trending condition. The same is true in reverse scenario; below the zero level and both pointing downwards – strong down-trending environment. Some traders use the
Signal Line crossovers to initiate their trades and Zero Line crossovers to confirm the initial trading bias. As stated before, because the MACD uses moving averages in its calculation, it often lags the price action.
Meaning, the Signal Line crossovers can appear late, and if a trader acts solely on these crossovers, it will affect his or her bottom line. In most cases, the losing trade signals appear in non-trending range bound conditions, when the crossovers occur pretty often in a brutal whipsaw manner.
Bullish or bearish divergences in the MACD Histogram can give traders an early heads up to a possible Signal Line crossover. Also, divergence usually forms when trading momentum is slowing down, however, it doesn’t mean that a reversal is imminent.
Therefore, studying the price action and determining the correct Market environment will help in deciding which trading signals to take.
Check out other article: Is Part Time Trading Worth Its While?
MACD indicator weaknesses…
The biggest downside of this technical tool and any other tool, for this matter, is that it uses price derivative in its calculations. Hence, it is unable to react to volatility increase. Remember, the MACD Line is calculated using the difference between the two (12-26) moving averages.
During the sudden or sharp moves (increased volatility) a trader can get whipsawed out of a winning position before catching that momentum change. The lagging nature of this technical tool can generate many trading signals that may cause break-even situations, or cause losses even during the strongest trending conditions.
Another thing, the MACD is not very good at identifying oversold/overbought market conditions. Since the indicator doesn’t have the upper and lower boundaries, in strong trending conditions, it can and most certainly will go beyond the historical oversold/overbought extreme levels.
In Summary
The MACD indicator is considered to be the most popular technical tool by Fx traders from all walks of life. It simply gives traders the ability to quickly spot the short-term momentum changes in trends.
Very few indicators in technical analysis stood the test of time and have proven to be trustworthy. The MACD indicator that was created almost half a century ago is among them.
Because of its versatility, this comparatively simple technical tool can easily be combined with any other indicator and can be used with the majority of classic trading strategies.


