Support and resistance trading in Forex is a popular and very powerful concept.
The majority of speculative strategies come with some type of support and resistance mechanics built into them internally. In a nutshell, support and resistance are specific levels or zones of a financial instrument at which the price action has a tendency to stop and/or reverse.
Since support and resistance is definitely one of the most extensively adopted technical analysis practice, in this article we explain what support and resistance is and cover its top trading strategies.
How do you trade support and resistance?
To trade Support and Resistance is no different than dealing with any other market strategy. As a matter of fact, it is the most popular style of trading among the pure price action traders. Since support and resistance are easily identifiable on a technical chart lots of speculators incorporate them with their current methodologies in one way or the other.
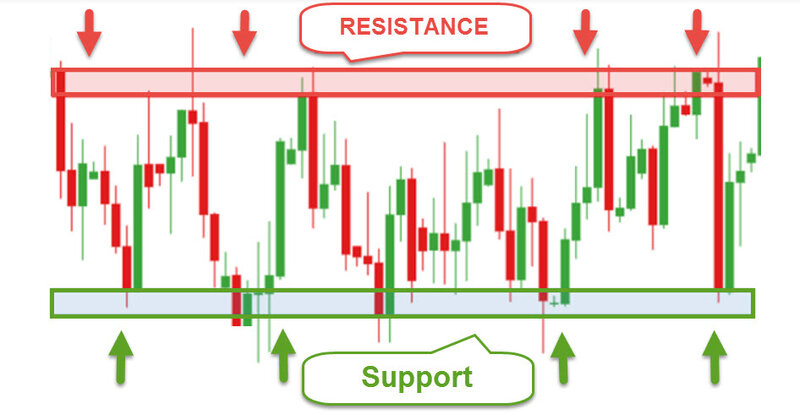
These are the areas on the chart where the price is most likely to; pause, bounce, or completely reverse its course. Therefore, trading support and resistance requires not much of a skill, as it requires more of properly determining those areas.
Meaning, there are strong and weak supports and resistances, hence choosing the right ones could make the difference in being a profitable, or being a loosing speculator.
Strong support and resistance levels are price points that hold the price action from advancing/declining further. For example, if the price action is to the downside, at some point in the future, it completely reverses into the up-trend, then the area where it actually has changed the direction is labeled, as being the strong level.
The weak levels/zones do not have that kind of power. Weak price levels can temporarily stop the price, even cause it to pull back, however, almost never a complete reversal. For example, if the price is trending upwards, it usually makes a high point, then retreats, after that it continues its original course by exceeding “the high,” making another higher-high.
The first high point is considered to be the weak level, because the price pulled back, and eventually it has broken through, creating that new higher-high. After the pause from a weak level, price in most cases continues its original course. The weak levels are like the re-fueling stations.
This is a simplistic explanation, there are subtle order-flow mechanics behind the weak levels/zones that a successful speculator needs to be aware of. At the same time, the weak support or resistance areas serve an aiding role in finding short term trading opportunities.
On the other hand, anytime the price approaches a strong support or resistance zone, it will most likely fail to break through and retrace for the re-fueling, then continue its original course. For instance, if the price comes up to a strong resistance level, it will regularly bounce off of it.
Of course, the price action might sooner or later break through it, nevertheless, it commonly pulls back from the zone several times before committing to the breakout itself.
Therefore, it has been widely accepted, the simplest method when trading, the support and resistance is to play these bounces. For some reason, it is easier for a beginner speculator to counter-trade against the major Trend, rather than just going along with it.
Meaning, it is easy to see a full-blown trend, and catch the corrections/bounces against it, rather than wait for the “re-fueling pullback” and proceed with the trend.
Another reason for the counter trade preference, it is easier to put a trade on, when leaning against a strong level, because you can clearly define the risk. Many support and resistance traders place their stop-loss orders behind the strong levels. Hence, the trade risk becomes a matter of making a logical choice, rather than a guesswork.
Here is common, counter trend thinking model:
- I have identified a strong level/zone…
- I see the price is respecting the level/zone, by pulling off of it…
- I am participating in the bounce, and placing the stop loss behind the level/zone…
From the above, we may conclude, the majority of support and resistance speculators, trade against the major trends. To paraphrase, the majority of support and resistance speculators, trade without trend consideration.
Hence, buying near support and selling near resistance certainly works, but the odds are stacked against you, for the long run. Trends in the Forex market are created by the monetary inflows from the major Banks and Institutions.
They have deep pockets of Liquidity, therefore trying to go against their flows is not advisable. These are the entities that create and/or fuel the trends. For this reason, it is financially healthy to ride with the “Big Dogs,” instead of fighting them, by trading against their positions.
Consequently, the most rewarding trading technique when using support and resistance is to get into near support zones in the up-trending market conditions, and sell short at the resistance areas in the down-trending environment.
When following this simple guideline, you drastically increase the odds in your favor, by placing yourself on the right side of the order-flows. Trends offer assistance in trade direction, which by the way is, winning the half of the speculative battle.
Case in point, if the market is in the up-trending mode (higher-highs and higher-lows), then you should be considering buying at, or near the support zones, instead of selling short at the resistance areas.
The up-trend signals to us that going long has a much better chance of scoring a profitable trade rather than selling. Considering that there is no guarantee that the levels/zones will hold, choosing to wait for some kind of proof that the market is respecting these areas might be a wise thing to do.
There are going to be some sort of technical clues along the way, helping you to make a trading decision. Search for candlestick patterns that confirm the reliability of those levels/zones. If you’ve missed the initial impulse move, then look out for bullish flags, triangles, wedges to confirm the upward momentum.
These classic chart patterns are nothing more than consolidation areas. Therefore, buying at the consolidation area base, which is going to be your support level/zone, is what you’d want to do, in this case. Expect a price action to break above the high of that consolidation area.
When such scenario develops, it confirms that the order-flow respects the whole bullish technical construct. Everything should be reversed when speculating in the down-trends. Selling, or going short at the resistance, consolidation base areas when the price action falls under the low of the consolidation itself.
Needless to say, when opening a trade in either direction, place a stop loss order a few pips below/above the support/resistance levels.
If you are entering after the initial move (impulse move), from the consolidation area, place the stop-order a few pips below the consolidation pattern for the up move, when buying the market, and few pips above the consolidation when selling, or going short.
If you are buying right at, or very close to a support zone, then it is advisable to book the profits before a strong resistance zone. Yes, you can always exit the trade before, at minor resistance, but in this case you have to maintain the risk to reward ratio that actually permits the trade itself.
Meaning, if the distance between the stop-loss order and the profit target offers less than 2:1 ratio, you may discard the trade to look for other opportunities.
As an example, let’s say, you’ve gone long the market right at the edge of the support area within the bullish triangle. If you trade on longer time frames such as: H-4 and/or Daily, then the distance between the diagonal lines of the triangle should be substantial in terms of the pip distance.
Hence, you may consider exiting the trade when the price reaches the opposite side of the bullish triangle.
Having a well defined exit strategy, in advance, is very crucial when trading with support and resistance methods. This actually might be the difference between being a profitable trader with awesome results or being a profitable trader with mediocre results.
How do you determine strong support and resistance?
As I mentioned before, support and resistance play an important role in the life of price action traders. The levels can be applied to any time-frame and to any technical chart. It is worth mentioning, the levels/zones are not time-frame specific, rather they are price related. Meaning, the hypothetical level of, let’s say, 1.4567 will be the same across all time periods.
Hence, it doesn’t matter whether you are swing trading the market on higher time frames, or day trading on smaller ones, drawing the high probability levels/zones is going to be a helpful skill that will serve you right for ages.
How Many Support and Resistances Are There?
Here is a short list of different types of Support/Resistances:
- Horizontal support and resistance
- Round-number support and resistance
- Trendline support and resistance
- Fibonacci sup/res levels
- Dynamic support and resistance levels (moving averages)
…and many more.
For the simplicity, we are going to discuss horizontal support and resistance levels in this article.
Instead of describing them as support and resistance “levels” we really should refer to them as “zones.” The reason, price action rarely stops at a certain level exactly.
The price action is likely to consume several price points (supports/resistances) before it commits to a certain direction. Meaning, it creates a price-spread where the bulk of the buying or the selling takes place, before advancing to a new territory.
A horizontal support level is the price point or series of price points that form a zone in which buyers become aggressive, thus preventing the price action from dropping lower.
Now, the buyers become more aggressive, because either there is a lack of sellers at the support level, or the buyers are buying-out all the sellers that currently are present at the level.
In the first scenario (lack of sellers) the price usually bounces off of the level, refuels at the nearby resistance, then continues its downward course. In the second scenario (buying-out), the buyers are starting a deeper correction, or reverse the price action completely in the new direction, by starting a new trend.
A horizontal resistance level is the price point or series of price points that form a zone in which sellers become aggressive, thus preventing the price action from advancing higher. Again, the sellers become more aggressive, because either there is a lack of buyers at the resistance level, or the sellers are simply out-selling all the buyers at the level.
The same dynamic is present for both scenarios. In the “lack of buyers,” the price bounces off of the level, refuels at the nearest support, then continues its original up-ward direction. In the “out-selling” scenario, the sellers causing a deeper correction against the major trend, or even a beginning of a new trend in the opposite direction.
Please also read: Busting The Myth Of A FOREX Market Maker
The Higher Time Frames Produce Major Support and Resistance Zones
Since support and resistance are something that is more tangible on the chart rather than just being an “imagery,” we may conclude, they are price points where the market is more inclined to pause, or bounce back. These are the price tags where large groups of market participants are, either take profits (sell), or open new trades (buy).
Naturally, when there are more traders buying than selling, as a group, prices rise.
More selling – prices decline. Hence, support and resistance are those turning points where the numbers of speculators are, at some point, at equilibrium. Then the balance of power swings one way or the other, the level/zone either holds, or gives up.
Consequently, the higher is the charting time frame, the stronger the potential support and resistance becomes from that time period. For instance, taking a cue from a weekly time period levels/zones will be more significant than from a daily chart.
The higher the time frame, the cleaner it is. They have lesser order-flow noise, so to speak. Smaller time periods are compressed into the higher time periods, similarly, as the smaller “Russian dolls” are compressed into bigger ones.
Meaning, when support/resistance from the higher time periods coincide with those support/resistance from the lower time frames, then these are going to be much more significant and more powerful levels/zones.
To be more precise, in actuality, it is the other way around. The levels from the smaller time frames, when cluster together, form these higher time frame levels.
The build up, the progression, of these major levels/zones start at a micro level. If we were to zoom-in, we would see that everything starts from the smallest time frame order-flows, and then expands on to bigger time periods.
Essentially, when we look at the major levels, we could see unfolding of the “matrix” that consists of these lower and higher time frame support and resistances, sitting one on top of the other.
The higher time periods such as; Daily, Weekly, are a good source for finding strong/major levels. These higher timeframe supports/resistances are powerful enough to pause or even stop a trending move in its track. Usually, these are the levels that produce deep pullbacks and/or reversals that medium-term speculators love so much.
That is why, lots of seasoned price action traders go to higher time frames to mark major levels/zones, then drop to a lower (trading) time frames for the entries, and trade management purposes.
These higher time frame levels/zones are like major guideposts for future price action developments. They also provide an overall market structure to the “ever-creative,” to our own demise, trading mind.
The medium-term charts such as; H-4; H-1, are good for marking the levels that serve as potential “refueling” spots for continuation moves. For example, if the price action is in an up-trending condition and comes up to a significant/major Weekly level, then bounces off into a lower H-4 level (support)…
We can assume, this H-4 level/zone might act as the “refueling” area for the continuation move back towards the Weekly level. Observing the price action behavior at the H-4 level/zone should provide some clues as to which way the price is most likely to proceed.
Smaller time periods, anything that is lower the H-1 (hourly) period, produce even less strong levels/zones. These levels are good for marking the Intraday “borders” where the price action is usually contained, ready to be broken out.
Once the price breaks through the smaller time frame level, it will most likely proceed towards the stronger levels/zone from the higher time frame. The reason being, the Liquidity that resides on these major levels. They act as magnets for the price action.
It is worth mentioning that interpretation of the price behavior around or at the levels is subjective, and depends mostly on the trader’s discretionary ability to read the price action itself.
You see, everyone has a different trading style, has a different opinion about their trading decision. To find out how trading is entirely subjective, I recommend reading the Jack Schwager’s –“Market Wizards.” The book explains how each speculator has approached the market differently, yet ends up being profitable with all that diversity.
Check out my own short read: “How To Become A Conscious Trader”

Do support and resistance really work?
Of course, they do… It’s all based on crowd psychology. For example, if you explain to the masses that there is such thing as support and resistance, then show them on the chart that they work, they believe it. It works like a self-fulfilling prophecy, when the majority believes and follows, it becomes easily predictable.
Especially, when there is money involved behind every market bet. However, this is the most basic and the most dumb down version of the explanation. I’ve heard it so many times on the forums from the so called “gurus.”
Here is more expanded, more detailed, and more logical explanation…
The whole concept of support and resistance is certainly the most highly discussed topic of technical analysis. Truth be told, the justification as well as the reasoning behind finding these levels seems easy at first, but as I mentioned before, support and resistance come in various forms.
Therefore, the conceptual execution of this type of trading method is much difficult to implement when one is given such task.
Basically, the support and resistance levels/zones are nothing more than certain price points on a chart that act as barriers, stopping the price action from advancing in any given direction.
For instance, Support that represents a Demand is not some hypothetical area where price magically bounces off, or turns around. There are real buyers that have bought the currency at that specific price range.
Now, there are various groups that do the buying. There are fresh buyers, buying the currency like crazy on the ask price, and there are those that have sold the currency right at the support, thinking that the support will not hold.
The latter group will be “in pain” as the market bids higher, eventually stopping these market players with their protective buy-stop orders. Hence, contributing even more to the buying frenzy.
There are also “weak sellers” that have sold the market before the resistance, at wrong location. As the market is rapidly coming up, they are being forced out of their sell positions, thus, fueling the upside move. All of these participants interact altogether to move the prices directionally higher, and make up the “demand” part of the supply/demand equation.
More demand than supply, price, bids higher, more supply than demand price falls lower. Now, everything should be reversed for the Resistance. The same market participants’ interplay, the same order-flow dynamics should be applied to the support concept.
So far we’ve talked about the horizontal support and resistance, however, there also are the diagonal ones. The diagonal or angled support/resistances, formed with the help of good old Trendlines.
In the up-trend, the resistance (supply zone) is formed by connecting the two lower peaks (lower-lows). The support (demand zone) is being marked by finding and connecting the two most recent higher-highs.
Extending those trendlines into the future from the past data gives a speculator some sort of pictorial understanding of where the supply/demand forces might interact with the price action. Now, combining those two methods into one, by marking the horizontal and the diagonal support/resistance, only enhances ones technical analysis.
Many technical traders use both methods to find good entry points, especially when the lines meet each other in a harmonious way.
Why support and resistance really work?
Many traders explain the reason behind this market occurrence that is due to its perception of the true value. Hence, when the price gets too expensive/cheap it is bound to stop, then revert back to find fresh demand/supply. Everybody wants to buy cheap and sell high when speculating in the markets.
However, ask yourself, how one can determine that the price is too expensive/high, or too cheap/low? One, and probably the most common way is to look at the support/resistance levels. These are the areas/zones where price action usually stops advancing, even changes direction.
The reason being, Central Banks as well as Institutional market players have certain currency exchange rates on which they are willing to deal. In case of the central banks, the buying and selling of currencies happen through the open market operations, to control the amount of money supply in the banking system.
Another reason for these operations, is to enforce, or should I say, uphold, certain monetary policies.
Institutions, on the other hand, have to deal on certain price levels, because of their size. Usually they exchange currencies within predetermined price range, where the buying or the selling takes place gradually, over time.
The reason they do that – Liquidity.
The liquidity, to fulfill their large orders, could be found only on certain price levels/ranges.
Therefore, since these market participants have the most influence and the most money, where their buying and selling takes place at specific levels/zones, they are the ones that create support and resistance levels that work. They do the buying at the support, creating demand and they do the selling at the resistance, creating supply.
Subsequently, at a support level, price has a tendency to appreciate as these major players are executing their buy orders. In contrast, at a resistance level/zone, price action is likely to bump into a “ceiling” and travel south as there is significant selling pressure there.
Support/Resistance and the Option barriers connection…
Another reason why Sup/Res levels work, the Option barriers. The option barriers are a type of financial instruments that are based on a number of different underlying securities. Although, they are considered to be exotic instruments, they are very common for trading the Fx market.
As an instrument, the “option barrier” is similar to standard types of options, however with an additional twist – the barrier. The “barrier” is a fixed price point, where the option contract is either triggered or ended. This happens, because these option contracts can be either “knock-in” or “knock-out.”
The difference between these two, the “knock-in” requires the underlying security to arrive at a particular price for the activation, while the “knock-out” is canceled if the underlying security reaches a given price level.
The “knock-in” option starts up inactive then, only becomes live once the underlying security hits a specified price level from the contract. The “knock-out” option starts out live, nevertheless is immediately terminated if the primary security hits a preset price point, referred to as the knock-out-price. As soon as, a “knock-out” contract is terminated, it becomes useless even when the underlying security retraces in price.
Therefore, if it is expected a major price movement in the actual security, then speculators would want to put their money into the “knock-in” contracts. At other times, if it is expected price action to stay range-bound for quite some time, then you would purchase the “knock-out” contracts.
Who and Why writes the Options contracts?
Entities, in our case Institutions that write, or sell options (puts and calls) earn a premium, the fee that the purchaser agrees to pay to the seller. The premium, collected when creating an option is based on a number of factors, such as the current price of the underlying financial instrument and the expiration (termination) date.
Basically, writing options represents a financial contract where a service charge (premium) is paid to the writer in return for the right to buy or sell shares of an underlying security (stocks, bonds, currencies, commodities, etc.) at a later date and price.
Yes, most of the time these are Institutions that are in the business of writing the options contracts for the income generating purposes. If we consider the fact that they have huge amounts of money at their disposal, then the small premiums they receive for every written contract get quite significant in the end.
The advantages of writing an option consist of acquiring an instant premium, you know in advance how much you’re getting paid. When the option expires worthless, you get to keep the premium.
Now, writing an option might entail losing a lot more than the premium collected. Nevertheless, there is, one rather considerable benefit that the barrier options offer speculators.
As a result of the higher risk that the purchaser receives, barrier options are typically less expensive and come with the built-in leverage. This invites a greater risk, but at the same time offers potential for greater earnings should one accurately predict the price fluctuations in the related underlying security.
Are you catching the drift? Do you see the connection between the large amounts of money, being placed as the barrier-option contracts, thus creating the very same price barriers?
In Conclusion
- Support and resistance trading Forex is a well-known and a very robust approach. A lot of trading strategies use some form of support and resistance elements in one way or the other.
- It is the most prevalent method of trading among the pure price-action speculators. The reason being, supports and resistances are easily recognizable on any technical chart.
- However, not all supports and resistances are created equal. There are weak as well as strong levels. Thus, selecting the right ones, when dealing in the markets, is what makes the difference between a profitable and a losing trader.
- The higher timeframes provide the strongest support and resistances, simply because there is less order-flow noise, and more monetary commitment. As a result, the higher is the technical charting time period, the more powerful become the levels/zones.
- Beginner speculators tend to gravitate towards the counter-trend strategies as opposed to going with the major tendencies. The big profits are to be found in well established market trends, as it is easier to trade in-line with the Institutional flows.
- Support and resistance trading works, because Central Banks and Institutional market participants deal on specific price levels, thus actually creating those very same levels.
- They have vested monetary interest at those specific price points, and they are willing to defend them “at all costs” if necessary.