Looking for the simple swing trading forex strategies that work… Then look no more! In this massive article we are going to cover some of the best swing trading strategies with practical examples.
Swing trading is among the most favored types of active trading, therefore traders that use this particular trading style, usually, are very good at understanding various forms of Technical analysis. Let’s dive-in, to find out some of the best and the most preferred swing trading strategies.
What is the best swing trading strategy
Actually, there are many best swing trading strategies on the market today, and no particular one will fit everyone, simply because everybody is different in their forex trading approach. Swing trading is a general term and mostly refers to a trading style rather than to a strategy.
Generally, a swing trading strategy centers around the concept of finding and capitalizing on the market turning points. Buying the bottoms and selling the tops of a particular swing point, hence the name of the trading style.
This is the primary aspect of a swing-trading plan.
Therefore, finding the best swing trading strategy depends on various factors, such as; the current market condition, the time period of a technical chart, the distance between the swing points and many more nuances that will be covered below.
However, before revealing the simplest and the most effective swing trading forex strategies, let’s cover some essentials…
Is Swing Trading Easy
Yes, and No…
It, certainly is easier than Day-trading or Scalping trading styles, but harder than Long-term trading.
Yes, because you do not trade the day-trading time frames. It is less hectic, less stressful, hence you are not over-trading. Swing traders pay fewer commissions, this in itself, improves their overall bottom line.
In most cases, the use of Fundamental analysis is not required when swing trading the markets. Swing trading is more flexible on the market direction; may trade with or against the dominant Trend.
No, because you have to be an expert market-timer. You have to time the entries and the exits on your trades, somewhat perfectly. This requires an immense amount of experience and patience.
The holding periods are longer than a day, which leaves you open to the overnight risk.
By keeping the trades overnight, traders that implement swing trading forex strategies are open to sudden, and not so unusual, FX market “gap-up” or “gap-down” against their positions.
Swing Trading Pros:
- Less active time than day trading or scalping (lessens the over trading risk)
- Swing trading is more cost-efficient, more commission effective
- Increases the overall profit potential by catching “the meat” of the swing-move
- Simplifying the trading routine by using only the technical analysis
Swing Trading Cons:
- Requires perfect Market Timing techniques for catching the swings
- Open trades include the overnight and the weekend risk
- Giving up on bigger profits, to favor the medium-term market moves
- Unprotected from sudden market volatility during the major Economic announcements
How much money do you need to be a swing trader
As much money as possible…
Seriously, all jokes aside, your capital requirement has to be linked to the overall risk, as opposed to, how much money you would want to make on a single trade!
It is easier to choose a specific number and say: “Well, I need five thousand, or ten thousand, or any other amount of dollars, for swing-trading.”
First, you need to set realistic expectations for your trading career, which means, setting realistic expectations on your trading returns.
Under-capitalization is the biggest problem in the retail forex space.
Wishing to make a thousand dollars per month on a thousand dollar account is financial suicide. Hence, making a 100% return, per month with such a small trading budget means, setting unrealistic expectations!
Even making 10% per month in this situation, in my opinion, is still unrealistic. Think, making somewhere between 3-5% per month when swing trading the forex market. Some might perceive these as conservative numbers, however, if the returns increase, the risk is also increased. You can’t have one without the other.
As a result, making consistently somewhere around 5% per month with swing-trading, is as real, as it could get. Hence, when you are under capitalized by having a small trading account, think of how much these percentages will be in dollar amounts – very little.
Even with such big leverage that is available in the Forex market, you still can make only so much, by following the risk management rules.
Now, you can run the numbers and calculate how much money you would need in order to meet your monetary requirements. For example, if you need $500 per month as an additional income, then, you would need the $10 000 swing-trading account.
Everything comes down to an understanding that Trading is like any other business. Hence, you have to run it as you would run any other business, by understanding the numbers, by understanding the accounting basics.
At the same time, swing trading currencies involves far less trading capital than other markets, thus it might be a good option for those that don’t have large amounts of cash for speculating in the financial markets.
Precisely how much funding you’ll need is centered around the specific strategy in use, which in turn affects your trade-risk and the overall bottom line risk.
Does swing trading work
In short… Yes! Swing trading works as long as a trader follows certain guidelines.
Any trading style can potentially work, everything is dependent on the trader itself. A good example of this statement is, famous Jack Swagger’s trading interview.
Where he has interviewed a bunch of successful traders, and guess what… All of them have had different trading styles to profit in the markets, proving that any trading style could work as long as, you make it work!
When swing trading forex, you have to be asking yourself two tactical questions:
- Am I swing trading with the trend?
- Or, am I swing trading against the dominant trend?
The reason, when you trade against the dominant tendency, your profit potential will always be limited, unless you are catching major market reversals. Which, in reality, is much harder to do, than everybody thinks.
The majority of the swing traders are not going after the reversals, but merely trying to catch the meat of the underlying swing move. Hence, trying to time the pullback and catch the bulk of the move against the trend, is more what they are trying to do.
The other group, swing trades the market, by trying to time the continuation of a dominant tendency. And that is where the money is made, because the continuation move yields larger profits, as long as the trend continues its course.
Can you swing-trade the range bound conditions?
Of course, you can, but the range itself has to be wide enough (100-300 pips), so when you get-in, you achieve decent gains in return.
The risk management is another factor to consider when talking about the profitability of any trading method for that matter. As I mentioned earlier, the more you risk on any particular trade, the more is your risk account wise.
The forex marketplace gives us the ability to leverage our trades, so we can get bigger profits. At the same time, we get bigger losses when not following the money management rules. We have to preserve our capital, if we want to trade another day. Period!
Now, when speculating in the markets we have two types of risks: the account risk (overall risk) and the trade risk (position size risk). The risk associated with the position-sizing directly links to the “overall risk” – the dollar amount of your trading account.
Therefore, first you need to determine exactly how much you’re prepared to risk on every single trade (trade risk) as this will impact your overall risk (account risk).
Commonly, one really should not risk more than 1-2% of the total balance on a single trade. This way, you’ll be in a position to trade, even if you catch a long streak of losing trades, which by the way, is bound to happen according to the Law of probability.
Bottom line, the profitability of a swing trader is dependent on managing two types of risk, the tactical strategy risk, and the one that comes from discipline. This way, you will be able to beat the market by a considerable margin in the long run.
Is day trading better than swing trading
Well, both styles require time, however day trading is more intense and traditionally takes up far more trading time. Swing trading, on the other hand, demands a lot less time and is far less hectic.
For instance, if you were to swing trade forex by using Daily charts, you would have been involved in what is called the Intra-week trading.
This would bring your actual trading time down to about 30 minutes to mostly an hour per week. Some swing speculators take trades that last days and weeks. Hence, trade management, such as: opening/closing the orders, moving stop losses to break-even, updating trailing stops, etc. is much more convenient than with Intra-day speculations.
In most cases, the Forex day traders participate in session trading. Usually they choose their favorite session and trade during these hours.
However, most of the time, the overlapping trading takes place, when the open trade remains open going into the beginning of the next trading session. In such cases, the time commitment stretches up significantly, where now it ends up being a full-time job.
Day trading is far more complex and is labor-intensive in every aspect of trading, which lots of people don’t realize. Also, with day trading, one can generate quick profits, however, there is “the other side of the coin;” one can lose a significant portion of the trading capital in a matter of couple bad trades.
With swing trading, the losses are slower, because of the slow time periods, hence the chance of going on tilt is somewhat controllable. You have more time to think through, to make justifiable, instead of emotional market bets.
I would say, day trading is classified more as an income-generating style of trading, at least on smaller accounts. While, the swing trading style is more suited to traders that are interested in the account-growth tactics.
Bottom line, in my opinion, when “comparing apples to apples,” the swing trading is less stressful and more profitable in the long run.
Also, read:
6 Forex Trader Types You Need To Know About: Uncover Your Tribe!
BUSTING THE MYTH OF A FOREX MARKET MAKER
Best Time Frames For Swing Trading Forex
The longer time frames, such as (Daily; H-4) are best suited for swing trading, here is why…
Since these types of traders hold their open trades anywhere from a few days and up to a week or more, the lower time frames are not much of a help when analyzing the markets with this style of trading.
Swing trading basics require keeping an open position for at least more than one trading session, and yet normally not longer than several weeks, maybe up to a month.
Therefore, analyzing the charts on a Weekly timeframe for the bigger picture, then entering the actual trade on a Daily, or H-4 (Four hour) timeframe is the usual swing trading practice.
This is also known as “multiple time frame analysis,” when traders use more than one time period in their decision-making process. The lowest swing trading time frame should probably be the H-1 (hourly). Anything below, produces too much noise and lots of false swing trading signals.
Forex Swing Trading Indicators
There are tons of swing trading indicators on the market today, however, we are going to focus on the most popular and the most accessible non-commercial indicators for the MT4-MT5 platforms.
Moving Averages:
The moving average is probably the first and the simplest technical tool that comes to my mind when considering the swing trading style. The indicator is easy to understand and is used to either identify or to confirm an existing trend.
It shows you visually whether the trading instrument of your choosing is in a trending or in a range-bound conditions.
Once this is established, you then can make a decision to go swing-trading with the trend or against it. We all heard the expression: “Trend is your friend.” Hence, swing trading with the dominant tendency is advisable.
As an example, here is the simple 3 EMA swing trading plan:
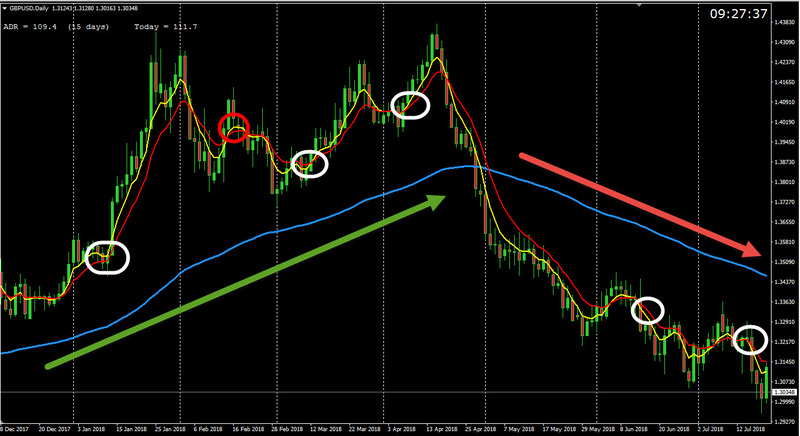
Where the blue line on the Daily GBP/USD currency pair is the 100 period EMA, the yellow – 5 period EMA, the red – 10 period EMA.
In the up-trending environment, shown by the 100 EMA go Long (to buy) the pair after the 5-10 EMA crossover. Better yet, go Long after the Daily candle closes above the red 10 period EMA.
In the down-trending environment, go Short (to sell) the pair after the 5-10 EMA crossover.
Better yet, go Short after the Daily candle closes below the red 10 EMA.
Stop-loss should not be more than one ATR, from the Average True Range indicator reading.
Trendlines:
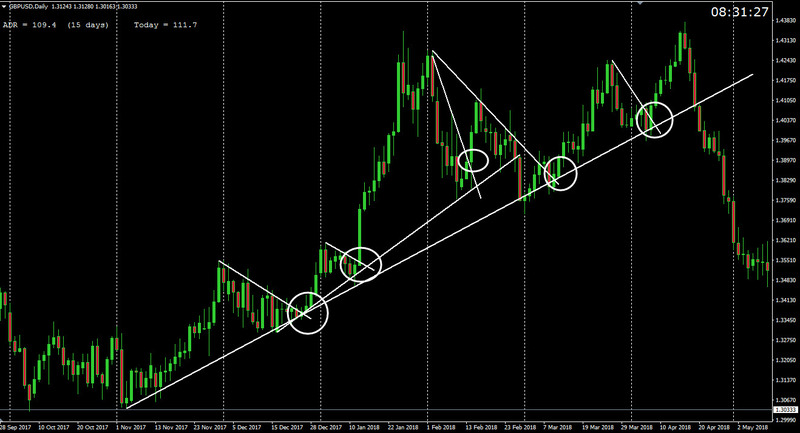
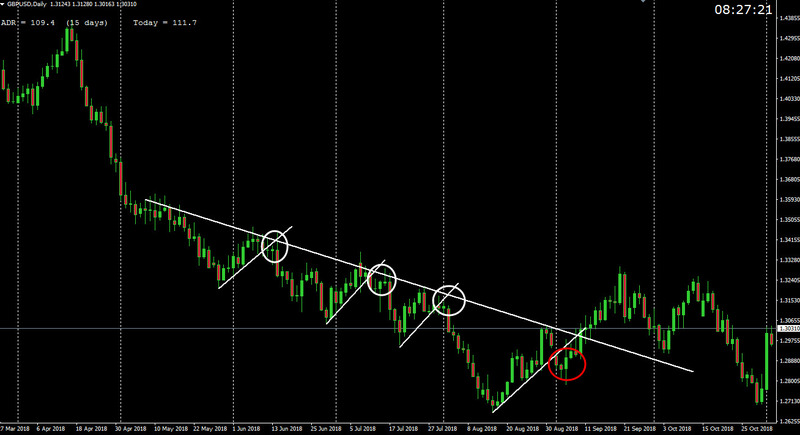
The use of trendlines when swing trading the Forex market is very similar to the use of the moving averages. As with the moving averages, trendlines, also show the dominant tendencies, where the decision to go Long or to go Short is simplified by the use of two lines on the chart.
The one is being used to show the long-term trend that is being respected by the price action, the other is being used for the entries:
Bill Williams Fractals:
A fractal is another technical tool, created by Bill Williams that can be used for swing trading quite successfully. The whole point of the fractals, to mark swing-highs and swing-lows on a trading chart. Look for the bullish fractal-up for going Long and for the bearish fractal-down for the Shorts.
Since the fractal is being formed within 5 candles/bars (two to the left, two to the right, one in the middle), it takes some time on the Daily chart to show up as the viable trading signal. By the time the fractal is confirmed, it is too late to enter the trade.
The fractal arrows commonly appear over the high or the low point, which usually is the center, the middle of the pattern and not where it finishes. In that sense, the fractals can be somewhat misleading, because when the signal is received, it is the third candle/bar to the right, which on the Daily time frame is too late.
Hence, looking for the previously formed fractals will do the job. Meaning, look for the most recent previously formed 2 fractals, one bullish Up-fractal, the other bearish Down-fractal.
Inside fractals do not count. The “inside fractal” is the one that is being contained between the other two bearish and bullish fractals.
Wait for the breakout of the either one to happen, for the directional clue. For example, when the most recently formed bullish fractal has been breached, go Long the trading instrument. Likewise, when the bearish fractal has been breached, go Short the trading pair.
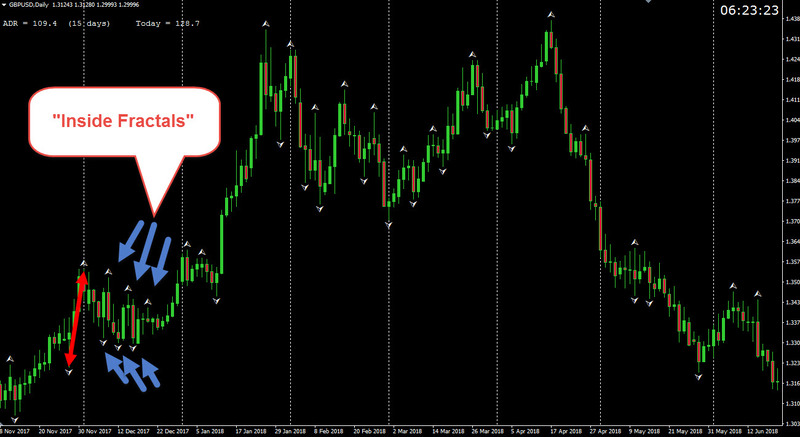
Essentially, this is a breakout trading strategy, however, it falls into the swing-trading category on the grounds of holding a trade longer than with the Day-trading or the Scalping approaches. This fractal technical tool is most helpful when implemented in combination with other commonly used indicators and techniques.
Read this, too:
How To Use The MACD Indicator MT4 Like A Pro
How Knowing About The Stop Hunting Forex Can Make You A Better Trader
Common Technical Oscillators:
Relative Strength Index (RSI)
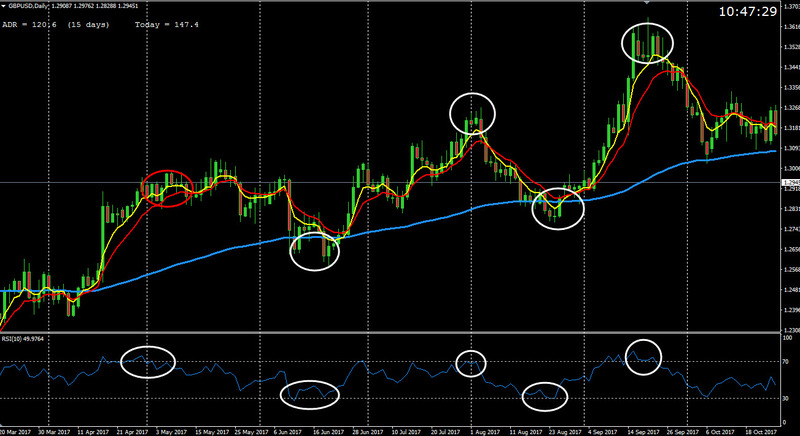
The RSI indicator is normally used in swing trading to determine any time the market is about to retrace back to its mean. And so the reading of more than 70 is usually regarded as an overbought condition and the reading of 30 or less, is generally considered to be as an oversold.
A typical plan of action that is used by active swing traders is to go Long a financial instrument when the RSI is below 30, and go Short whenever it becomes greater than 70. The indicator parameters for the “buy” or for the “sell” can be changed to fit a market environment, and a trading timeframe by a speculator, to produce better overall results.
Nevertheless, it is good to remember that during really strong trends, the corrective reversals may take some time to develop as the overbought or the oversold conditions may last for long periods of time.
For example, if there is a strong bullish tendency when an overbought state is recognized, then the market might take longer than expected to initiate a reversal. That is why recognizing the actual Market environment is so crucial.
Stochastic Oscillator
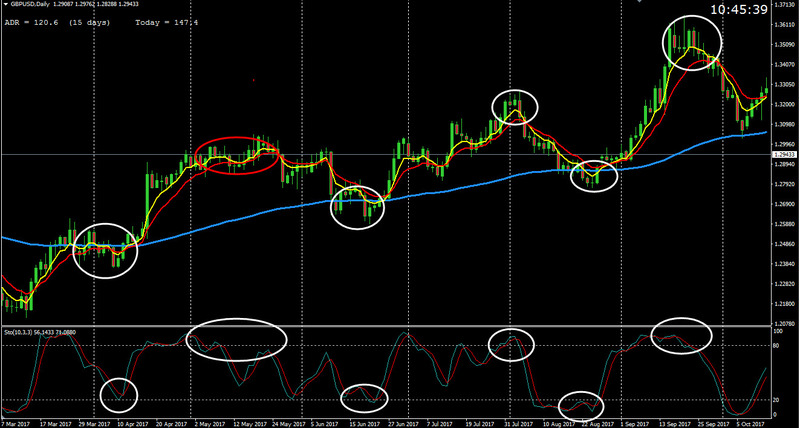
Developed by George Lane, the Stochastic Oscillator is more of a Momentum indicator rather than an oversold/overbought technical tool. It shows the relationship of the closing price of the high/low range with the default look-back period of 14. It also has extreme boundaries of the zero and the hundred mark, which it tends to oscillate, hence the name “oscillator.”
In order to show, visually, the overbought/oversold levels on the chart the 20 and the 80 levels have been added later on, which was not the original objective of the indicator. Therefore, readings below 20 are considered to be as the overbought levels, and above 80 – overbought.
There are different versions of this tool, the Fast (5-3-3) settings, and the Slow (10-3-3; 14-3-3) settings Stochastic. Many swing traders will use this popular technical tool to gauge momentum along with the overbought/oversold conditions.
I’m not going to discuss what exact settings are best for the swing purposes as these are adjustable, and every speculator should do its own due diligence on their strategy, to find optimal settings. Honestly, there are no magic Stochastic settings that will present more winning trades over the other.
Fibonacci Retracement & Extension Tools For Swing Trading:
Fibonacci is another excellent tool for swing trading the markets. It can be used as a standalone technical tool or in combination with other tools for pinpointing high probability trades.
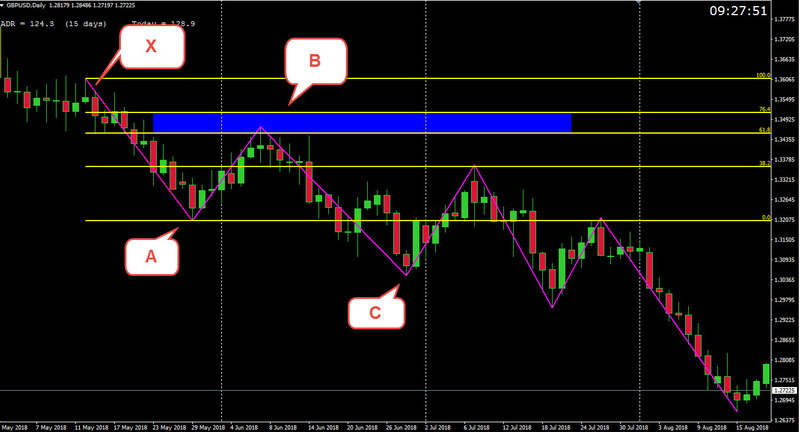
The retracement tool is being used by swing traders to locate invisible support levels for trading with the dominant tendencies. The extension tool is being used more so in uncovering the profit-taking zones.
Especially when the trading instrument is at the all-time highs or at the all-time lows.
The Fibonacci Retracement
The retracement tool includes a bunch of default mathematically derived numbers. However, not all of them are used by seasoned swing traders. The most common and the most used retracement numbers are: 38.2, 61.8, 78.6 percent.
The tool calculates precisely how much the current price action moves from its high-to-low, or its low-to-high has retraced percentage-wise.
Now, these percentages are mathematically taken from what it is called a Fibonacci sequence and is outside of the scope of this article. For more information about the sequence check this publication. Needless to say, every retracement level is a potential area of a support zone.
However, the most solid area is being considered the zone between the 61.8 & 78.6 numbers, as the later is the deepest retracement number.
It is widely accepted, the 78.6 number as the “point of no return.” Meaning, if the retracement goes beyond this number, then it is not a “retracement” anymore, but a possible start of a new impulse move.
The Fibonacci Extension
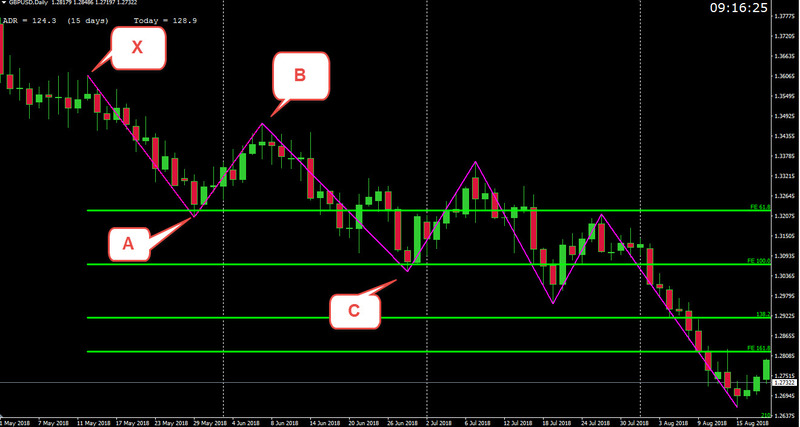
As we have mentioned previously, the Fibonacci extension tool is best used when a trading instrument is at new highs or at new market lows. For example, if you have bought a currency pair and it begins to break out, forming new highs, you would want to have some sort of reference point to book the profits.
Therefore, the fib-extension tool comes to the rescue and gives a trader profit taking levels.
The most common extension levels are: 61.8, 100, 161.8, 261.8%. These are potentially the most probable levels where the financial instrument might stall, and even completely reverse the course.
They act as invisible resistance levels and provide a general idea for technical reference points.
Now, the biggest challenge when using both Fib-tools, are finding the correct Swing Lows and Swing Highs to start with. Some traders use the last swing in conjunction with the lowest swing. Others, simplify the matter by choosing the latest and the most recent High/Low points.
Again, there is no right or wrong way of doing it, everything comes down to a trader’s discretion when choosing the swing method. Nonetheless, drawing your Fibonacci tools from recent High/Low points worked quite well for me, as I do not burden myself with looking for areas of multiple Fib-confluences.
Another problem, there is no way of knowing, in advance, which retracement/extension levels will play out, according to your belief. Any of the levels may or may not behave as solid zones. Everything comes down to your ability to recognize which ones out of many react more than the others. And this my friends comes with practice!
Forex Swing Trading Signals That Work
Divergence:
Divergence is one of the popular technical signals that more or less is structured and doesn’t make you play a guessing game. It is either present or it is not present on a chart, thus removing the subjectivity from a decision-making process.
The whole concept of this technical signal, it indicates a potential, I underline, a potential signal for a price to move directionally upwards or downwards. This is why swing traders love to participate in this type of market development. Seasoned traders use divergence to evaluate the underlying momentum and for determining the possibility of a price reversal.
Accordingly, we have a positive (bullish) and a negative (bearish) divergences. Now, these two types of divergences are also divided into “classic” and “hidden.”
Classic bullish/bearish signals are considered to be effective for reversal scenarios, and the hidden signals belong to a continuation group.
Needless to say, swing traders prefer the classic divergences over the hidden, because it is easier to find them on the charts.
The divergence trading involves most of the common technical oscillators such as: RSI, Stochastic, MACD, Williams %R, etc. Therefore, in cases of the classic bullish/bearish divergences, the price of a trading instrument makes a high (bullish), or a low (bearish) readings, but the technical indicator fails to so.
On the contrary, the indicators show quite the opposite readings, contradicting the price behavior, thus signaling a possible move in the opposite direction.
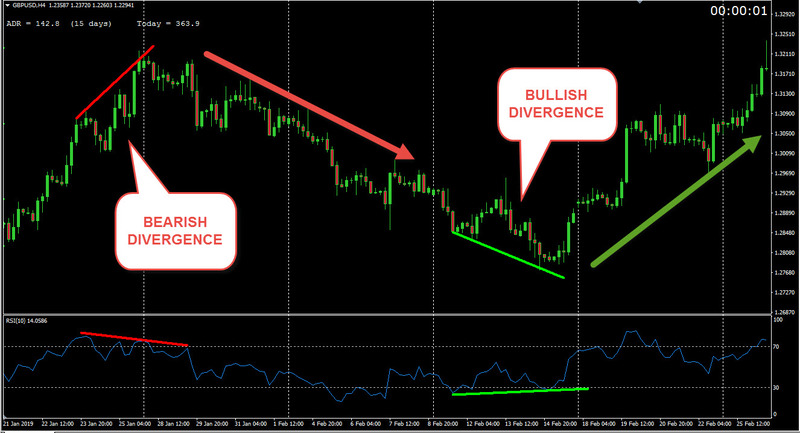
As we can see on the H-4, GBP/USD chart, bearish divergence signaled price could move downwards and it did. Bullish divergence did the opposite, signaled a potential upwards momentum which has played out nicely. Here are few pointers to consider when swing trading with divergences:
The Classic Bearish Divergence signals, the price could start to move to the downside
(The actual price action is moving higher, the indicator gets lower readings)
The Classic Bullish Divergence signals, the price could move to the upside
(The price action is moving lower, but the indicator is getting higher readings)
The Divergence itself may develop between the price of any financial asset and nearly any technical oscillator or fundamental data for that matter.
In strong Trending conditions, Divergence can last longer than expected before it actually materializes as a trad-able reversal on a technical chart.
Candlestick Patterns:
There are dozens, if not hundreds, of Japanese candlesticks available for trading.
Each has its own meaning, and back in the day, traders could read them as we simply read books. Meaning, the Japanese rice traders could read the markets through the use of candlesticks as we Westerners read the books.
However, we are going to discuss only the few good reversal candlestick patterns as in this article we are talking about the swing trading. Therefore, there are only a handful of candlestick formations that are going to be relevant to this discussion.
If you need more info on how to master the Japanese candlesticks, here is a good resource to check.
To remember, no particular candlestick needs to be evaluated in isolation. The overall concept is, even if you identify an important reversal candlestick, you really should wait for at least another one for confirmation.
Now, this “overall concept” doesn’t apply to aggressive market players, as they rarely wait for the confirmations. That is why, knowing about what type of a trader you are makes more sense than learning all the fundamentals or all the technical, for that matter.
The Engulfing Candlesticks
Bullish engulfing has its name based on the fact that it sort of swallows/consumes the previous candle, hence the name – engulfing. Bullish engulfing signifies a shift in a bull-bear battle. The close of the engulfing candle happens above the previous candle’s high.
This suggests, the buyers are taking charge by overwhelming the sellers, thus printing the engulfing print.
This particular candle is most important when it appears right after a lengthy downtrend. For example, a financial instrument has been in a strong downtrend, and at some point “the music has to stop.” The bears are either closing their positions or hitting a strong support zone.
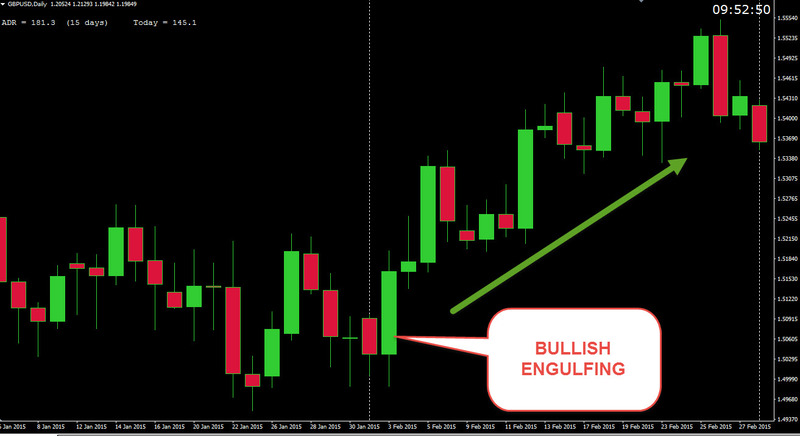
In either case, if we have an engulfing print, in most cases, it indicates a beginning of a new swing. This candlestick is even more powerful, when it engulfs several of the previous bearish candlesticks.
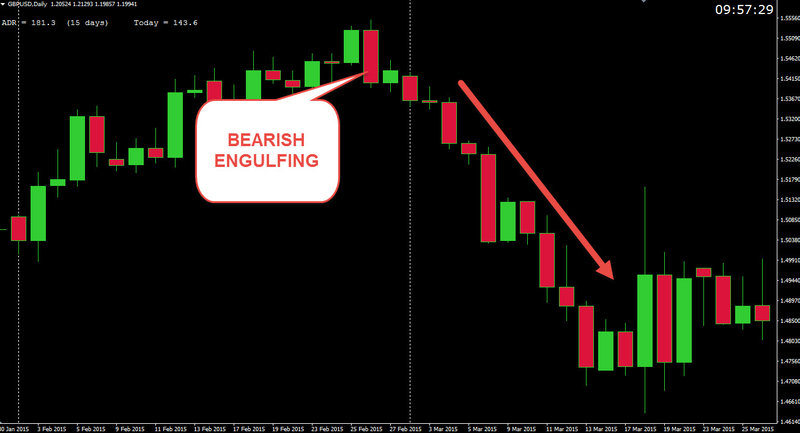
Bearish Engulfing is the opposite of the one we just discussed, it engulfs previous bullish price action signaling the reversal swing move. Bearish engulfing signifies a shift in a bull-bear battle. The close of the engulfing candle should be above the previous candle’s low point.
This suggests, the sellers are taking over by overwhelming the buyers, thus printing a bearish engulfing print.
The Hammers or The Pin-Bars
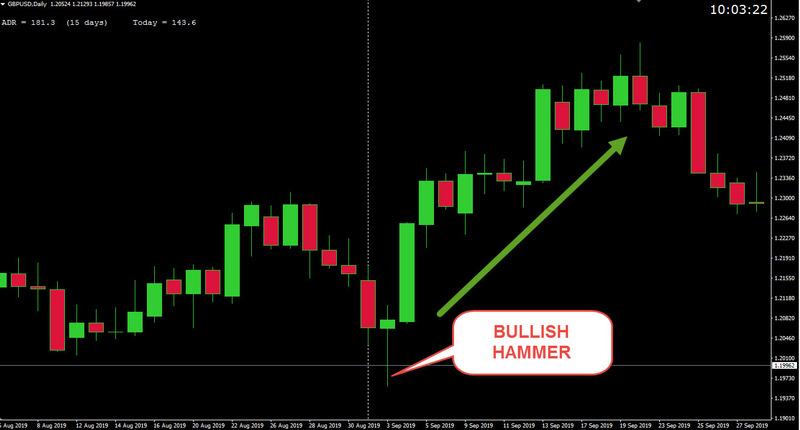
The “hammer” or also known as the “pin-bar” is another strong reversal pattern. Like with the engulfing, the hammer shows the bears (sellers) capitulation in down-trending conditions. However, this candlestick formation also works well with support and resistance strategies.
For example, if the price has declined, passing a strong support level, then rebounded and formed “bullish-hammer” right on, or slightly above the level, then this indicates that the bulls (buyers) have taken control.
What happens after the following candle, is really what you have to pay attention to. The following candlestick, in most cases, should confirm the bullish scenario.
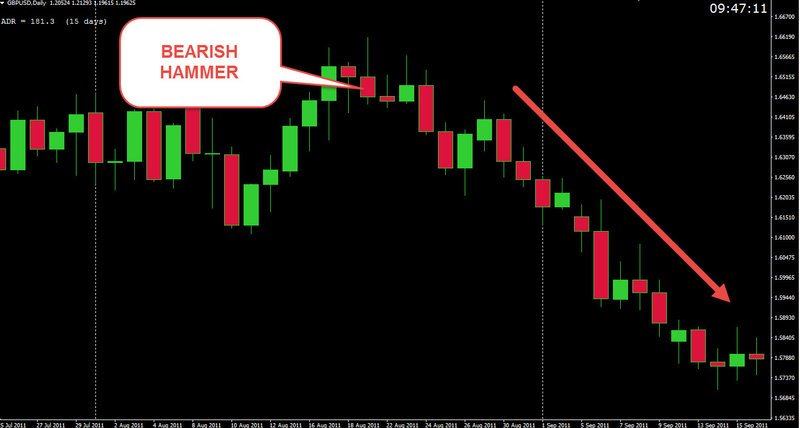
The same goes for bearish hammer, or the “inverted-hammer.” Very powerful reversal candlestick pattern in an up-trending environment. It signals bullish capitulation, either temporarily, as a start of a correction, or a beginning of a new trend in the opposite direction.
Either way, catching the momentum shift for the purpose of swing-trading is possible with these powerful candlestick patterns.
The Dojis
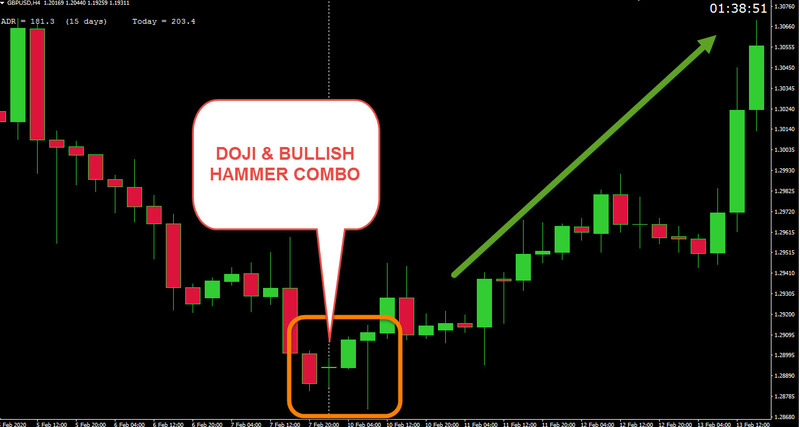
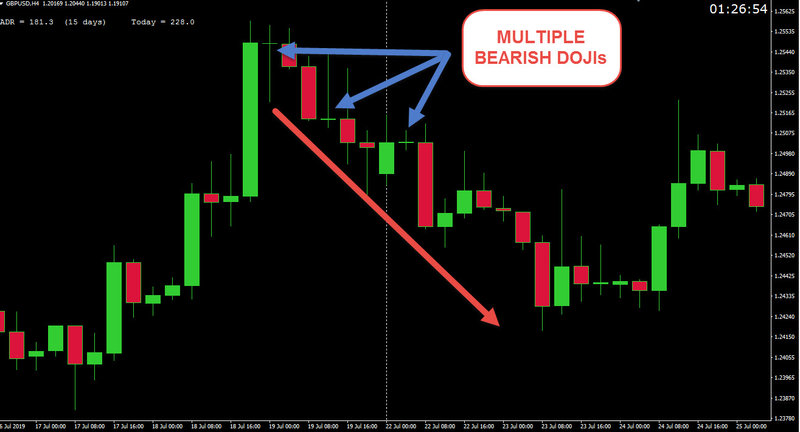
The Doji is the most common, but at the same time is the most tricky candlestick pattern for the swing trading. The reason, it contains reversal, as well as, continuation properties when shown after a strong move to the upside or to the downside. Hence, a contextual market analysis is required for this pattern more so, than for the other two, previously explained.
And, as with the Hammer candlestick, a Doji requires a second candle as a confirmation tool. The reason being, it has no real body (shaped like a cross) to give any type of clue, as to who controls the situation, the buyers or the sellers. Therefore, in an overbought, or in an oversold market, the doji signifies a correction/reversal scenario.
Adequately, when the Doji appears in the middle of the market move, in many instances, it signals a continuation scenario. For this reason, swing traders pay attention to Doji, as well as, where on the chart it actually appears.
Now, candlesticks could be used as a stand-alone tool, and frankly, many traders just do that; they employ various price action strategies, based solely on the use of the candlesticks.
However, swing trading involves the use of many technical indicators, as previously discussed. Hence, many swing traders combine the use of indicators with the use of candlestick.
To clarify, the swing traders will use technical indicators to identify Market stages, then use the candlesticks as a confirmation for their directional hypothesis. A good example would be, the Divergence swing trade.
Where a trader identifies an overbought market condition on Daily, or H-4 timeframe with the use of RSI indicator, then confirming the signal with the bearish engulfing candlestick pattern.
Therefore, the use of Classic Divergence technical signal in combination with the above mentioned reversal candlestick patterns is a common practice among many swing traders in the Forex market.
Top 3 Best Swing Trading Strategies:
Conclusion
As I’ve mentioned before, swing trading is a style rather than a strategy that can produce quite substantial market profits in the hands of an experienced and disciplined speculator.
Although, a trader needs to commit a good amount of time in learning “the ropes” and keeping track of the market swings, the whole technical side of this style of trading is not as challenging as day-trading.
Swing traders prefer longer time periods (Daily and H-4) for their trade entries, because there is less market noise as well as a lesser chance of over-trading. These traders usually operate on the multi-week time frames and care more about “the big picture” rather than the daily market fluctuations that are prevalent on the shorter time periods.
For this reason, swing traders almost always hold their open trades overnight. Swing trading typically necessitates a bigger stop loss than a scalper or a day trader, which means that having a disciplined mind with the ability to sit through draw-downs is a must.
Since swing trading forex can be done with much lesser trading capital, again because of the biggest leverage, and requires lesser trading attention, it is a reasonable alternative for speculators who really want to keep their regular jobs, but at the same time engage the markets.

